What is the difference between Business Intelligence and Reporting?

- SOFTWARE DEVELOPMENT
- BUSINESS INTELLIGENCE
- POWER BI
We often mean the same for reporting and business intelligence as they help businesses analyze their performance based on Big Data, but they belong to distinct usages. The risk of not identifying the differences may result in using the wrong tools for the given task.
To understand how they compare, we need to separate business, and end-user needs based on different functionalities.
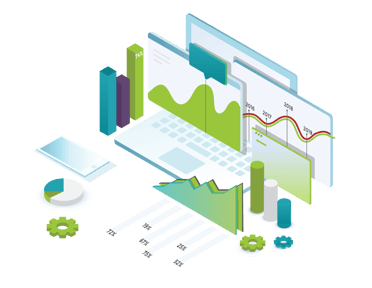
Both software is paramount to businesses as they help us answer different questions to improve overall function and reach higher market share. Reports tend to focus on periodical data such as monthly sales revenue, weekly leads changes, or daily customer orders. It also initiates short-term actions as reporting software examines data in a micro view. In contrast, business intelligence looks at more expansive data relationships, for example, examining our shipping performance broken down by region, warehouse, team and product.
|
|
Business intelligence (BI) analyzes the pastBI focuses on what has happened in the past and how we can improve our business processes based on Big Data. It helps organizations make operational decisions by providing actionable insights. BI analyses data in a macro view as it collects data from multiple systems (internal and external) and identifies trends with various objectives. It uses interactive dashboards with charts, graphs and animations to present raw data; furthermore, BI ensures data visualization and understanding in-depth. BI is fundamental for every business as it provides forecasting and trend analysis. |
|
|
|
Reporting software analyzes the past and current timeReporting software is mainly used to track the performance of a given department, such as sales, marketing or human resources. This software transforms real-time operational and administrative raw data into multidimensional reports to track given business activities' effectiveness (i.e., ROI). Reporting software also supports creating custom reports based on given business needs, it gives managers the freedom to change the measurements and visualizations from time to time without programming skills. |
|
How to determine which software suits better to your business processes? First, you need to decide whether you would like to analyze micro or macro business performances. BI tools offer advanced insights to analyze and benchmark for data-driven decision making. Reporting tools evaluate your microenvironment as they handle an expected volume of data. Our team uses Microsoft Power BI to help companies of all sizes analyze data and share insights. With this technology, enterprises can monitor their business more closely and get instant answers with rich dashboards available for every device.
| Business Intelligence features | Shared features | Reporting software features |
|
|
|
Share this post on social media:
Posts by Tag
- IoT (17)
- Smart cities (16)
- E-mobility (14)
- Energy Management (10)
- Mobility (9)
- Software development (9)
- Marketing automation (6)
- RPA (6)
- Robotic Process Automation (6)
- electric vehicles (6)
- Internet of Things (5)
- IoT solution (5)
- Marketing software (5)
- Smart Building (5)
- Business Intelligence (4)
- Custom applications (4)
- IoT platform (4)
- Uipath (4)
- electric charging (4)
- IoT devices (3)
- Properties (3)
- AI (2)
- BI (2)
- Montu (2)
- Multi-device functionality (2)
- Omnichannel (2)
- RPA Budapest (2)
- Smart city (2)
- UX design (2)
- app development (2)
- artificial intelligence (2)
- crm (2)
- crm software (2)
- electric charging station (2)
- machine learning (2)
- marketing campaign (2)
- optima (2)
- API Testing (1)
- Agriculture (1)
- Automated Testing (1)
- BYOD (1)
- EV (1)
- Energy Communities (1)
- Event insights (1)
- Event report (1)
- Green IoT (1)
- HR (1)
- IT Outsourcing (1)
- ML (1)
- Power BI (1)
- Resource Management (1)
- Smart Home (1)
- Smart Office (1)
- TaaS (1)
- UX/UI Design (1)
- Xamarin (1)
- cloud (1)
- cloud computing (1)
- cross-selling (1)
- data driven marketing (1)
- digital twin (1)
- dynamic customer segmentation (1)
- esg (1)
- inbound marketing (1)
- industry 4.0 (1)
- onprem (1)
- onpremise (1)
- scalability (1)
- software robot (1)
- testing as a service (1)
- upselling (1)
Recent Posts
Read On
- BUSINESS INTELLIGENCE
- ESG
The importance of data visualisation in ESG reports
Data analytics play a key role in ESG efforts, as they help us see how our business and internal processes work, how we communicate our sustainability achievements transparently and in a data-driven manner. However, for ESG reporting, it is crucial not only to collect data but also to present data...
- BUSINESS INTELLIGENCE
- BI
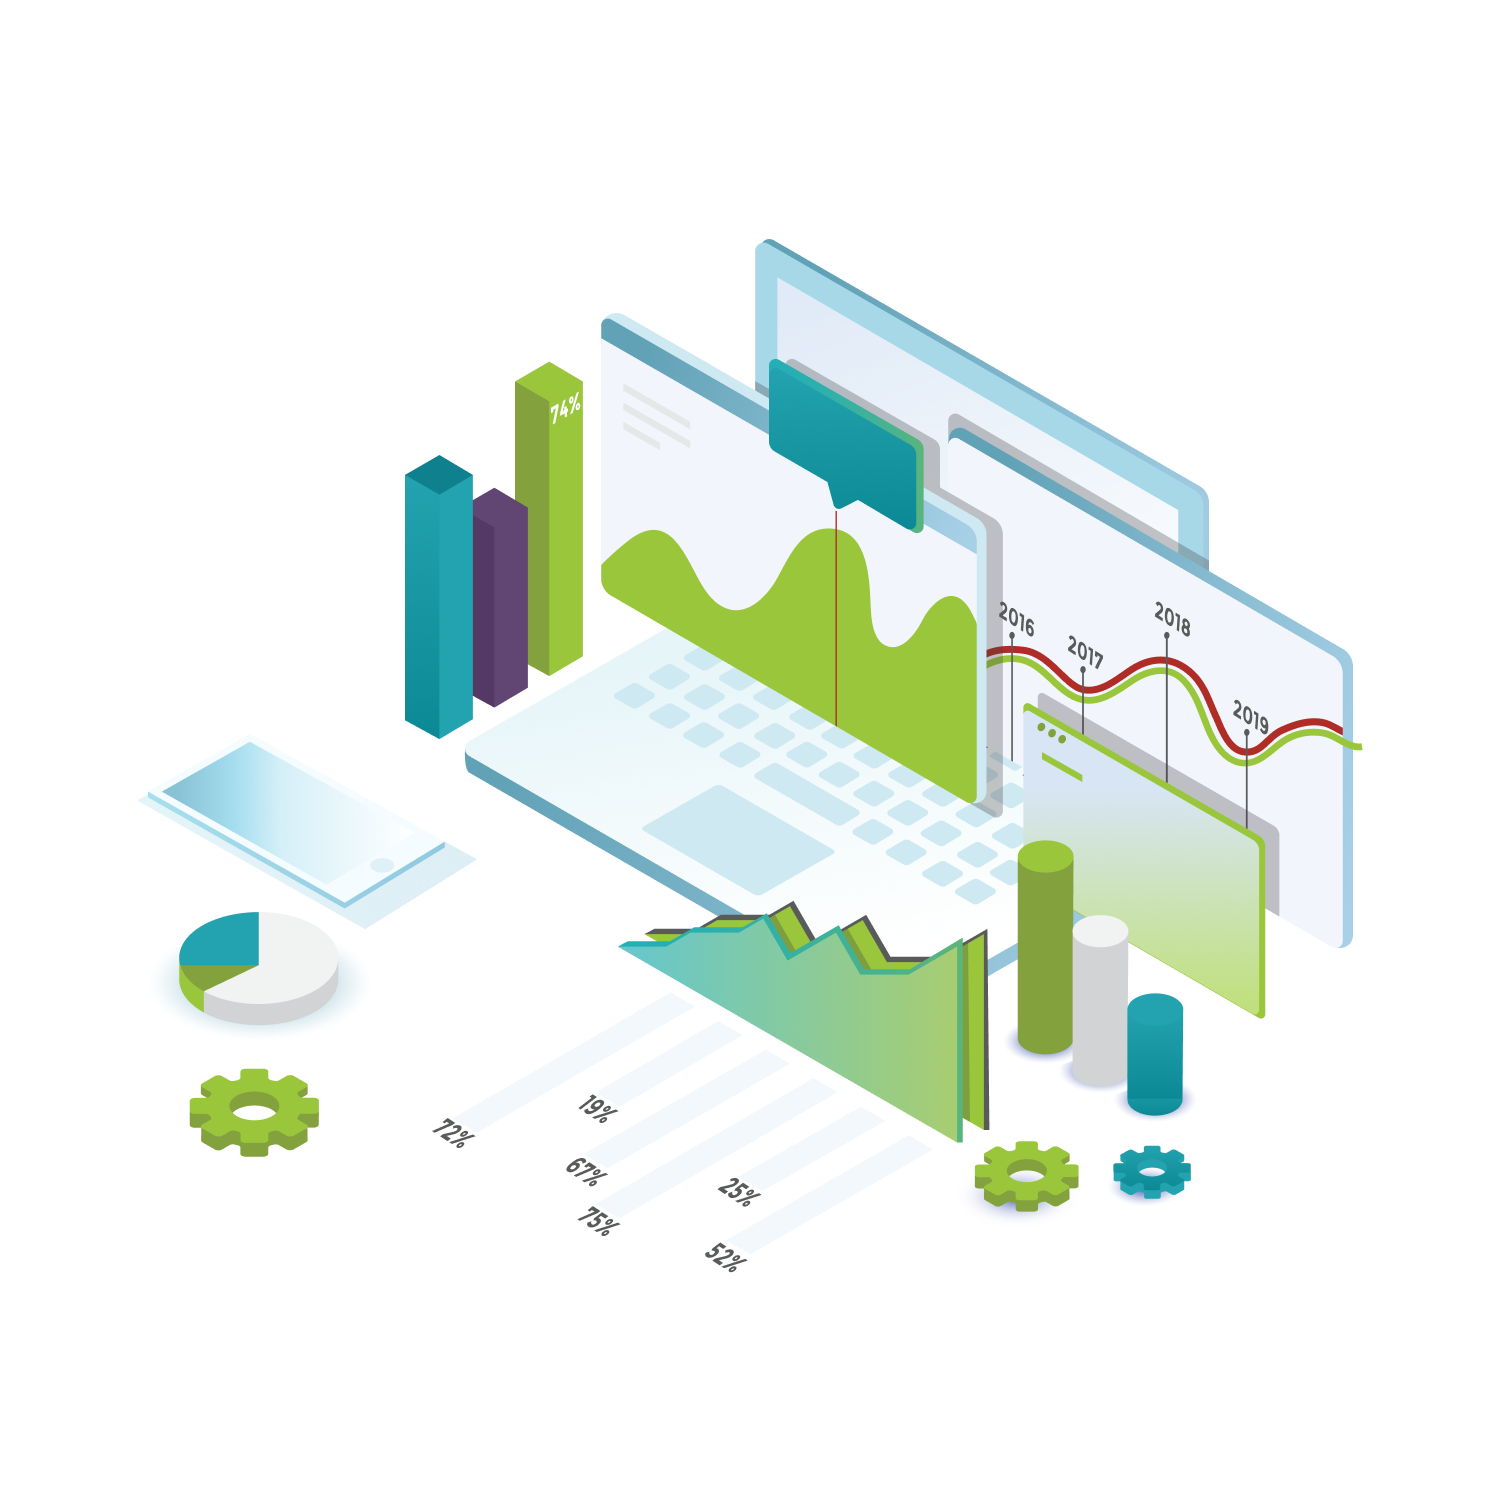
Data visualization trends in business intelligence: A broad overview from chart types to tech directions
Data visualization is essential to business intelligence as graphically illustrated large datasets help analysts have a deeper, more comprehensive understanding of incoming data in a shorter period. To visualize trends and represent numerical insights effectively, analysts have to select the proper...
- IOT
- INTERNET OF THINGS
- ENERGY MANAGEMENT
- SMART CITIES
What is an energy management software, and how can you benefit from it?
Energy prices are rising daily as the demand for energy for residential, commercial or business use increases. According to Enerdata, a 4% increase in European electricity consumption has occurred since 2020. To reduce operational costs and facilitate energy-efficient consumption, IoT-based energy...
